2008 Red Sox Projections
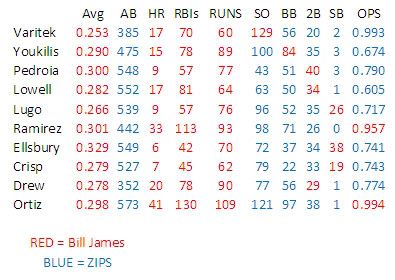
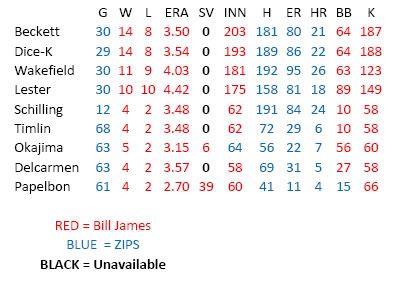
The following charts and graphs are based on a combination of data gathered from Bill James and ZIPS.
_______________________________________
_______________________________________
_______________________________________
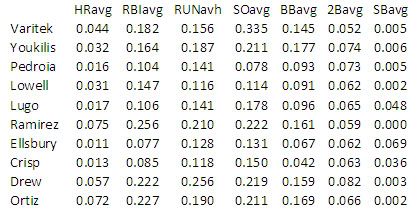
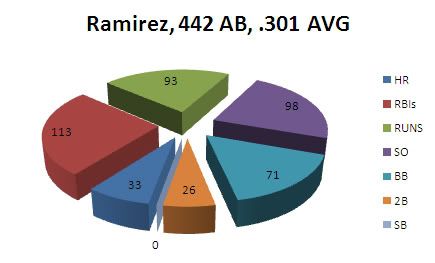
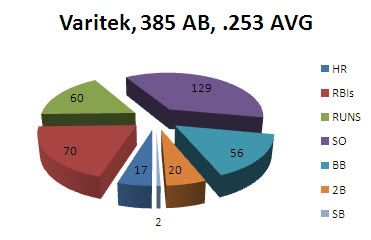
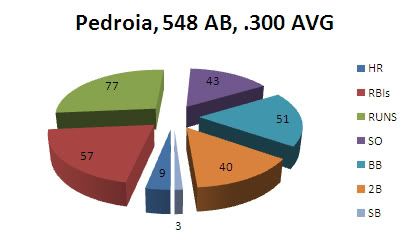
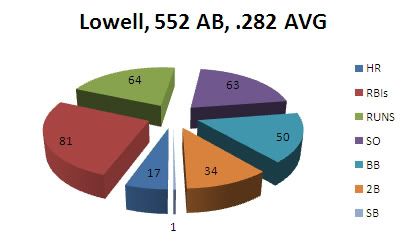
These pie charts are based on the batting data as seen above. They show the ratios of various events based on projected at bats.
_______________________________________

_______________________________________
_______________________________________
_______________________________________
_______________________________________
_______________________________________
_______________________________________

_______________________________________

_______________________________________
_______________________________________
_______________________________________
_______________________________________
_______________________________________
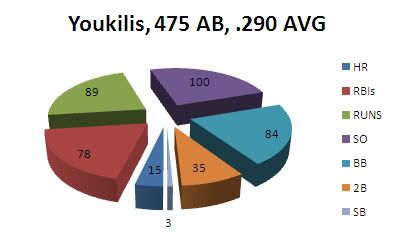
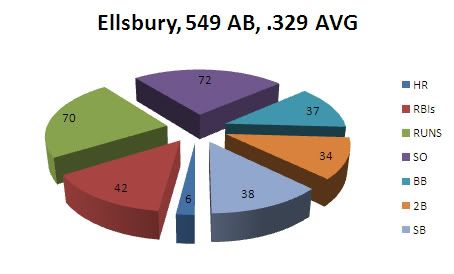
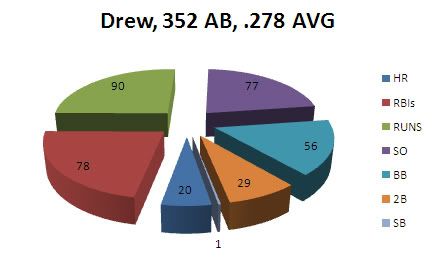
These pie charts are based on the batting data as seen above. They show the ratios of various events based on projected at bats.
_______________________________________
_______________________________________
_______________________________________
_______________________________________
_______________________________________
_______________________________________
_______________________________________
_______________________________________
_______________________________________
_______________________________________
Labels: baseball, predictions, Red Sox
This entry was posted
on Thursday, March 13, 2008 at 3/13/2008 03:56:00 PM.
You can skip to the end and leave a response.
![]()


0 Comments:
Post a Comment